
#48 Understanding RBI Annual Report
Conspiracy? Or coincindence?

Hey everyone!
Last week, I took your help in selecting a new topic for me to write on.
As promised, here are the results:

Almost 35% of the responses wanted me to write on FinTech, with WealthTech coming in at second. “NBFCs” and “IPO documents of Startups” got equal votes at 3rd and 4th.
But the important question is: Who’s that subscriber who selected “All the Options Given”? 🙄
So final decision:
I’ll be announcing a new section soon, primarily focusing on Wealth-Tech and also covering interesting stuff from FinTech.
The posts will continue to come on Saturdays, alternating between Wealth-Tech and Banking (where I’ll start covering NBFCs extensively).
I think this is the best way I can accommodate the Top 3 requests by all of you. 🙂
For other topics, I’ll continue to write on LinkedIn and Twitter and you can also email me.
Onto today’s topic!
What’s up with RBI?
So one of the biggest releases from the RBI this week was its Annual Report. Now this is a fairly complex piece of document (running into 350 pages) and frankly, you shouldn’t be concerned with the entirety of it.
But there are a few basic Did-You-Know(s) we’ll cover here:
This particular Annual Report covers the accounts for the last 9 months only, instead of the full 12. This is because RBI has officially changed its accounting year from this financial year. This is also why I covered the RBI Annual Report in August last year and May this year (it takes two months for publication).
The bigger question is - Why the change?
Well, it is actually based on a recommendation by a committee headed by Dr. Bimal Jalan. (In fact, a lot of things revolving around the RBI Annual Report is dictated by this committee). Quoting it,
“the Committee recommends that the RBI accounting year (July to June) may be brought in sync with the fiscal year (April to March) from the financial year 2020-21. Historically, the July-June year would have been linked to the agricultural seasons which is not a consideration in these times”
One of the proposed benefits for such a change was to better estimate the surplus transfer to be paid to the Government.
What surplus you ask? Why the Government?
To understand this, let’s recall the main functions of RBI:

Let’s focus on the highlighted (in blue) portions for now.
As a manager of foreign exchange, RBI is allowed to buy and sell dollars. Thanks to the Bimal Jalan Committee, RBI is also allowed to pass the profit from selling these dollars, to the government as a surplus.
Here comes the conspiracy theory:
As per notable economic commentator Vivek Kaul (and a lot of other people), there’s a theory that RBI sold a chunk of these dollars in a hurry to finance our cash-starved government rather than actually making a meaningful difference in the foreign exchange market.
The data corroborating this conspiracy are these two charts (from Vivek Kaul’s post)
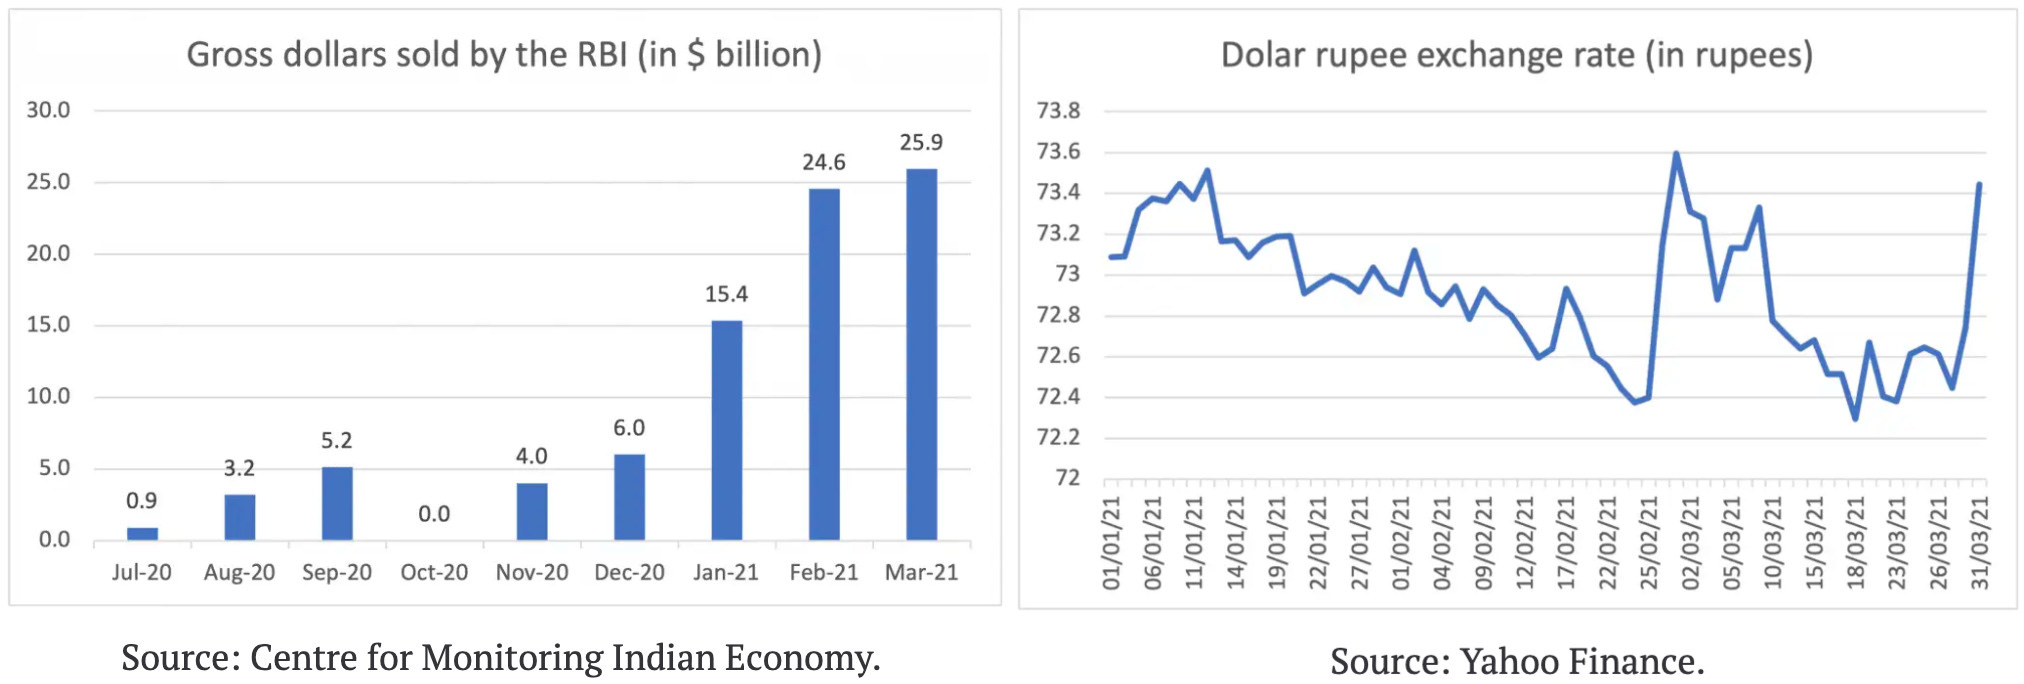
Left image:
Explanation: RBI sold a lot of dollars (more than 77% of total dollars sold in the last nine months) AFTER the Budget was presented (see Jan, Feb, March).
Right image:
Explanation: The dollar-rupee exchange rate did not move much during these months (it hovered in the range of ₹72.4-₹73.6 only). If the sole purpose of selling (or buying) dollars is to move the exchange rate towards a particular direction, clearly that didn’t occur.
Conspiracy:
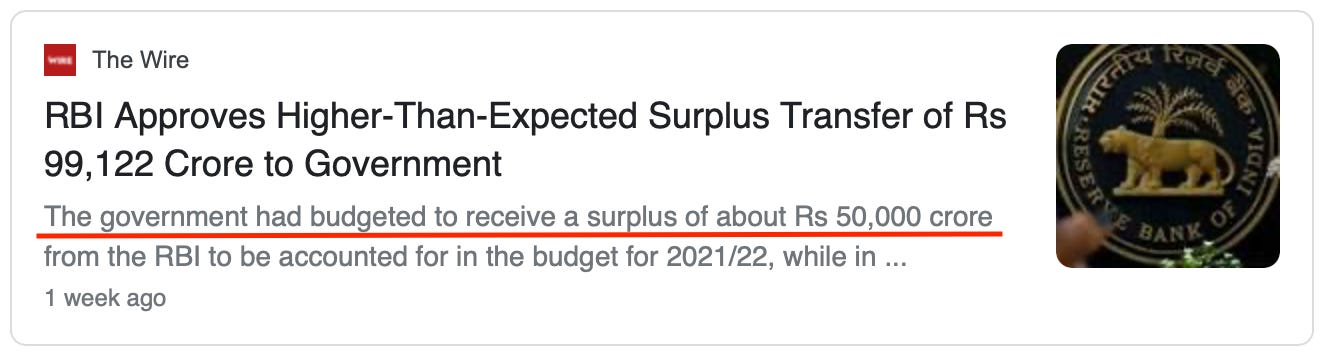
RBI deliberately sold all these dollars to generate an “accounting” profit and this is why it could transfer ~₹49,000 crore EXTRA than what the Government itself expected the central bank to transfer this year.
To top it off - All of this in a span of only 9 months!
Check out my post from August to learn how much it transferred last year.
But then again, we can never know, can we?
There’s actually ANOTHER reason debunking this conspiracy:
RBI did not even make much profits from selling dollars. It was ₹20,000 crore higher than last year. I personally wouldn’t say this figure justifies the word “only” but it also doesn’t explain the full ₹49,000 crore extra that the RBI could transfer.

The answer lies in “expenditure”. While income fell my a meagre ~11% y-o-y, expenditure fell by a whopping ~66%. Thus, RBI had much more freedom to transfer surplus.

The next question is - Why the fall in income and expenditure?
Apart from the obvious answer (9 accounting months in FY21 versus 12 months in FY20), there’s actually more.
Income:
Fall in income was driven by the fall in Interest Income, which fell ~37% due to:
Low rates across India, as well as globally. (Repo rate was decreased from 4.40% to 4% in May 2020). This is what RBI earns by lending money. And..
Banks keeping a lot of money with RBI in the past year to earn income through reverse repo rate (This is interest paid out by the central bank). Banks did this because they were afraid to lend out money to other people/businesses, considering the uncertain economic conditions and thought it would just be safer to keep it with RBI.
Expenditure:
Fall in expenditure, as highlighted in the image above, was mainly due to:
Lower employee expenses, and..
Lower provisions (due to healthy provisions kept last year). Think of provisions as emergency funds for the RBI. This figure, determined as a percentage (to be kept between 5.5%-6.5%) of the balance sheet, is known as the Contingency Risk Buffer. Yes, this is also prescribed by the Jana Committee.
Phew! I tried to make this as simple as possible. If you’re into complex stuff, you can read this thread by investor Sahil.
In Other RBI Developments…
RBI has fined HDFC Bank ₹10 crores due to irregularities in its auto loan portfolio business. This is actually an issue dating back to July last year, when I had written down multiple things going wrong at HDFC Bank at the same time. (Read: Is everything okay at HDFC Bank?). In case you’re wondering, this is NOT the highest fine by RBI. It was actually on ICICI Bank, to the tune of ₹59 crores three years ago.
RBI has released the Quarterly Statistics on Scheduled Commercial Banks. A few things that were interesting to me are:
1. Greater Mumbai, Delhi, Bengaluru, Chennai, Hyderabad and Kolkata - together account for over 46% of total bank credit.
2. The share of CASA (current accounts and savings accounts) increased by 2% compared to last year.
3. And as expected, private banks continue to gain market share (both in loans and deposits) at the cost of public sector banks.
I love feedback. If you want me to cover a particular news, want to get featured, write a guest post or wanna simply say hi, do reach out to me at anirudha@bankonbasak.com or LinkedIN or Twitter. Meanwhile, like this post and share it around?
All views and opinions shared in this article and throughout this blog solely represent that of the author and not his employer. All information shared here will contain source links to establish that the author is not sharing any material non-public information to his readers. His opinion or remarks on any news are based on the assumption that the source is genuine; thus he is not liable for any information that may turn out to be incorrect. This blog is purely for educational purposes and no part of it should be treated as investment advice. Using any portion of the article without context and proper authorisation will ensue legal action.
Very nicely explained:)
Very nicely explained:)